|
On this page: Fernbridge | Scotia | Weott | Fort Seward | Miranda | Leggett
Current Eel River Levels - Northern California
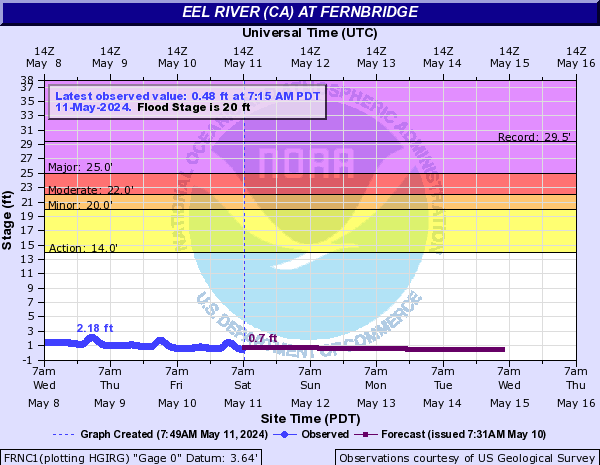
Eel River stage and flow at Fernbridge (scale)

Fernbridge webcam
Eel River stage and flow at Scotia (scale)


Bull Creek stage and flow near Weott


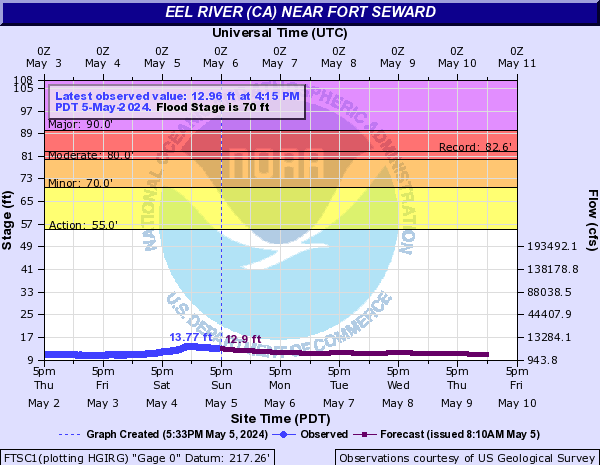
Eel River stage and flow at Fort Seward (scale)


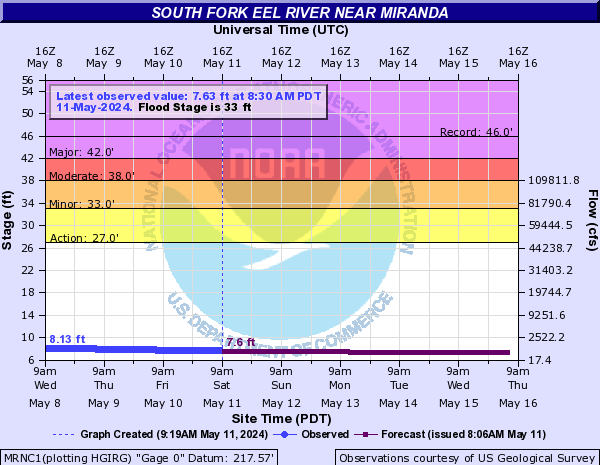
South Fork Eel River stage and flow at Miranda (scale)


South Fork Eel River stage and flow at Leggett


Chart below is the 30-year historical temperature and precipitation data for Scotia.

30-year historical temperature and precipitation data for Scotia.
 - Max. Temp. is the average of all daily maximum temperatures recorded for the day of the year between the years 1981 and 2010. - Max. Temp. is the average of all daily maximum temperatures recorded for the day of the year between the years 1981 and 2010.
 - Ave. Temp. is the average of all daily average temperatures recorded for the day of the year between the years 1981 and 2010. - Ave. Temp. is the average of all daily average temperatures recorded for the day of the year between the years 1981 and 2010.
 - Min. Temp. is the average of all daily minimum temperatures recorded for the day of the year between the years 1981 and 2010. - Min. Temp. is the average of all daily minimum temperatures recorded for the day of the year between the years 1981 and 2010.
 - Precipitation is the average of all daily total precipitation recorded for the day of the year between the years 1981 and 2010. - Precipitation is the average of all daily total precipitation recorded for the day of the year between the years 1981 and 2010.
|